Budget Planning: Facilitating Quarterly Budget Development


The process of creating quarterly budgets often involves complex data analysis and collaboration challenges. Manus streamlined spreadsheet management and analysis, enabling more accurate and efficient planning, which led to improved financial forecasting and decision-making.
Related Use Cases
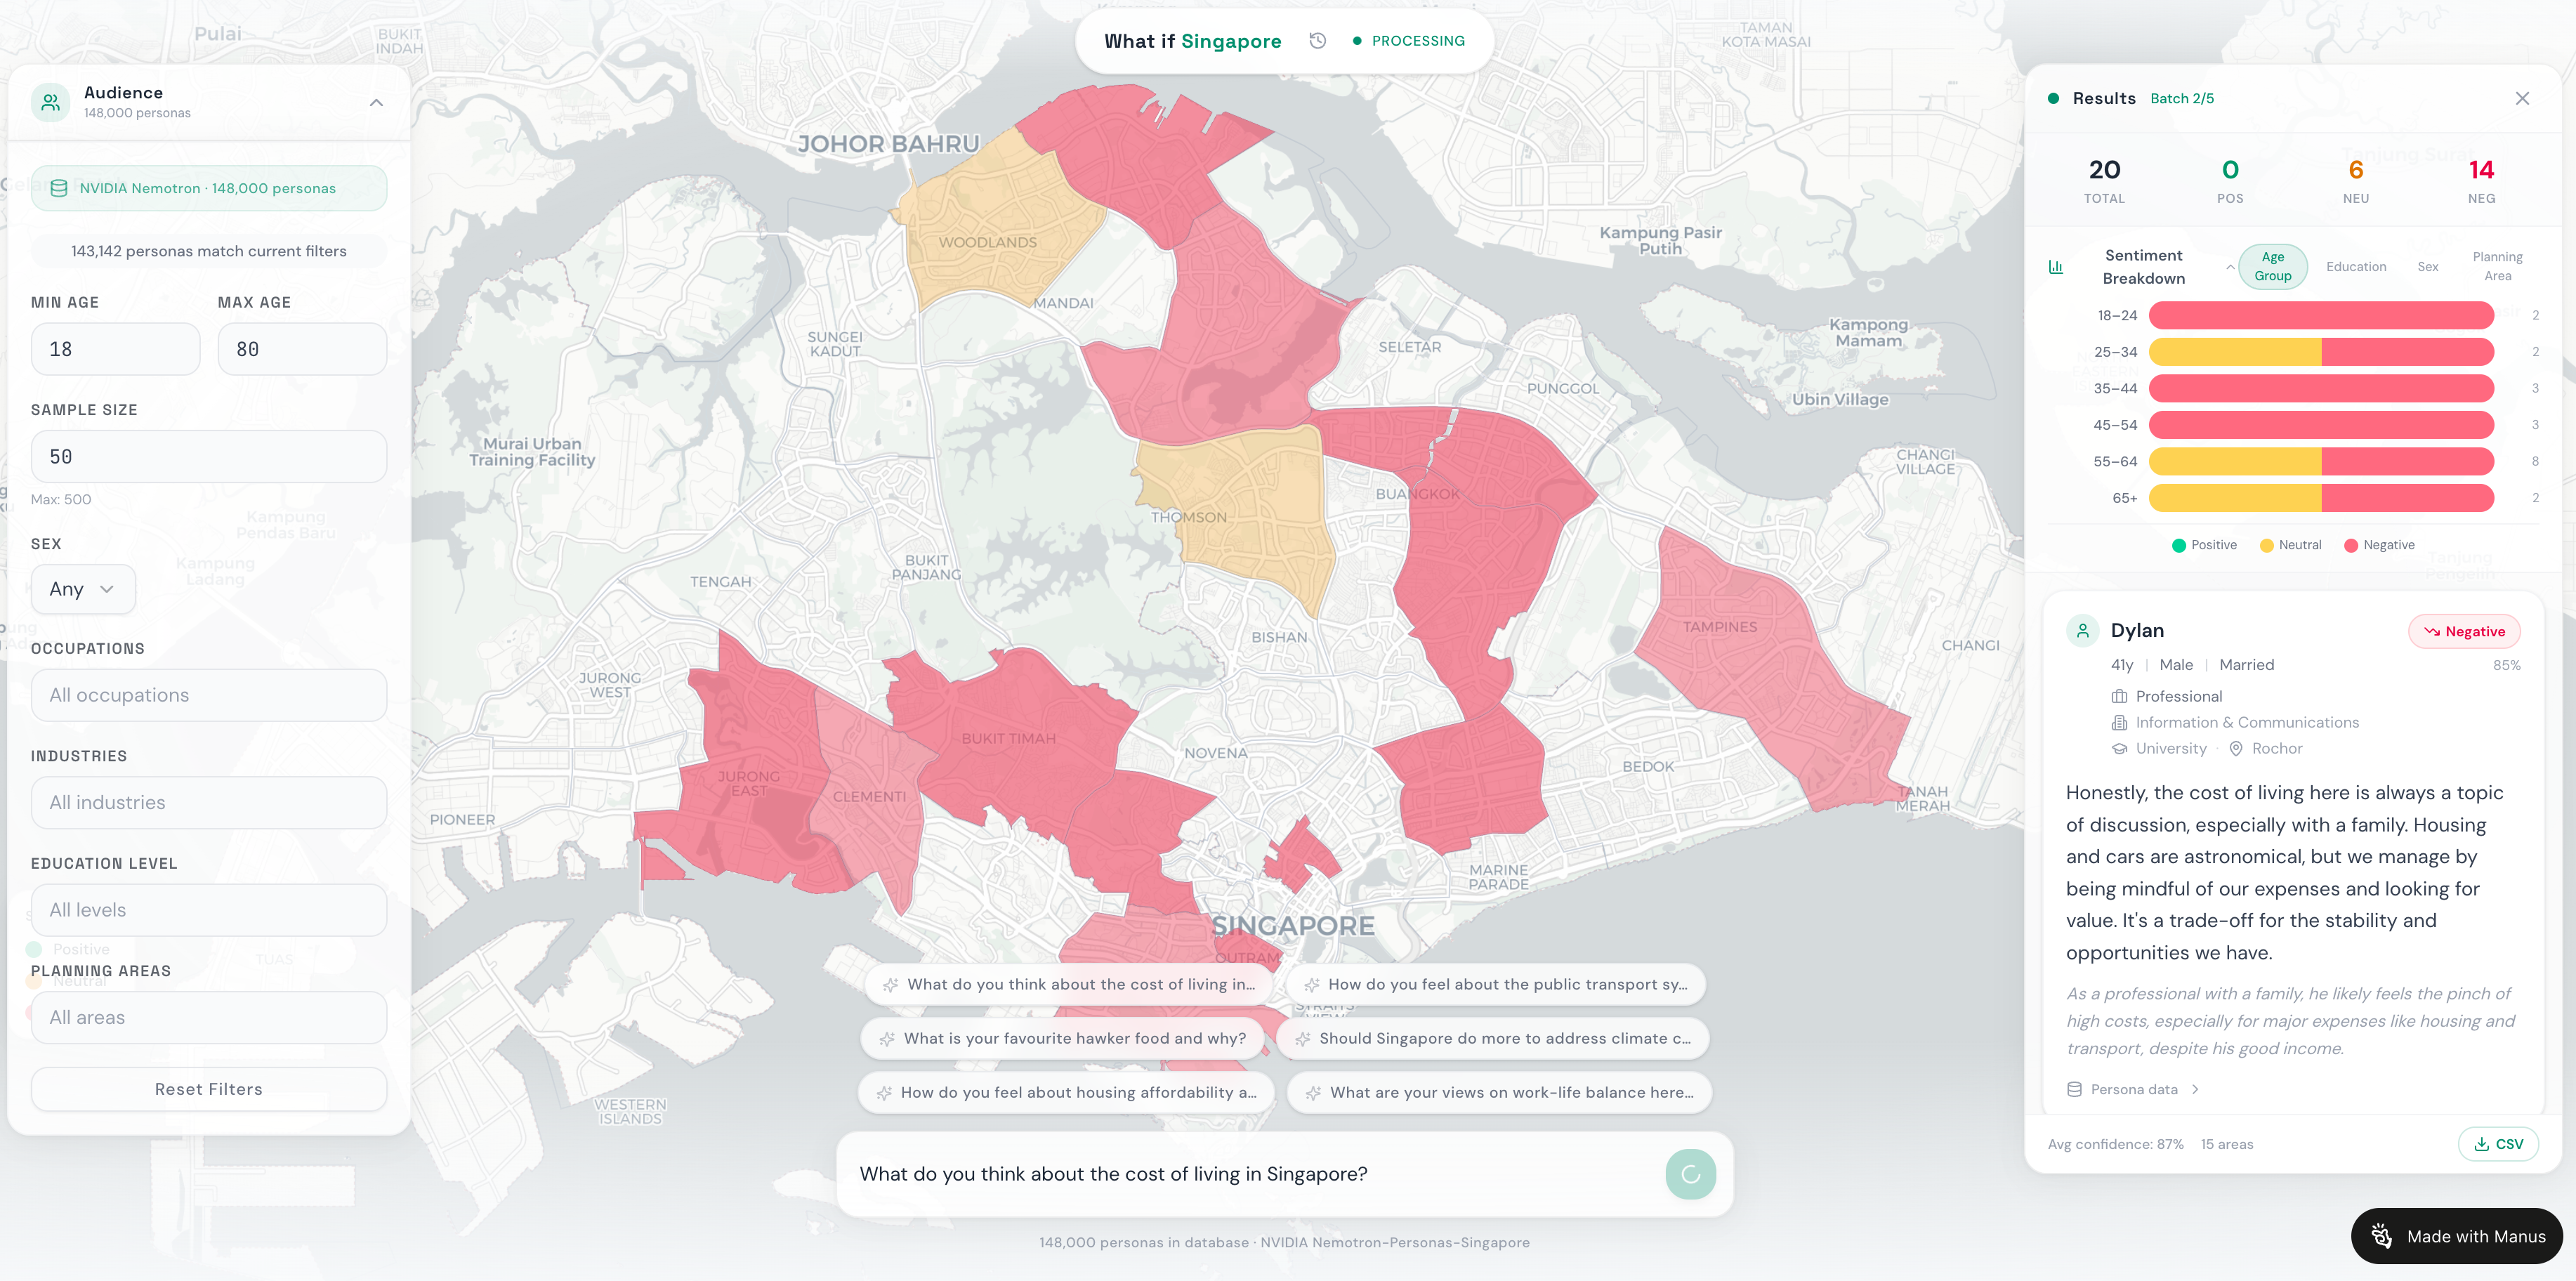
Data Visualization: Build an Interactive Synthetic Opinion Explorer
This project addressed the challenge of understanding complex simulated data by enabling users to interactively explore and visualize large datasets. The portal lets people query a large database of AI-generated personas and visualize simulated public opinion across demographics and geography. Manus reviewed the uploaded spec, architected the full-stack application, built interactive features including map visualization, sentiment charts, streaming responses, query history, and CSV export, then deployed the finished tool as a live website.

Research & Analysis: Visualizing AI Startup Websites
The use case addressed the challenge of efficiently gathering and organizing information from numerous AI startup websites for comprehensive analysis. Manus facilitated data collection, visualization, and organization, resulting in clear insights that supported decision-making and strategic planning.
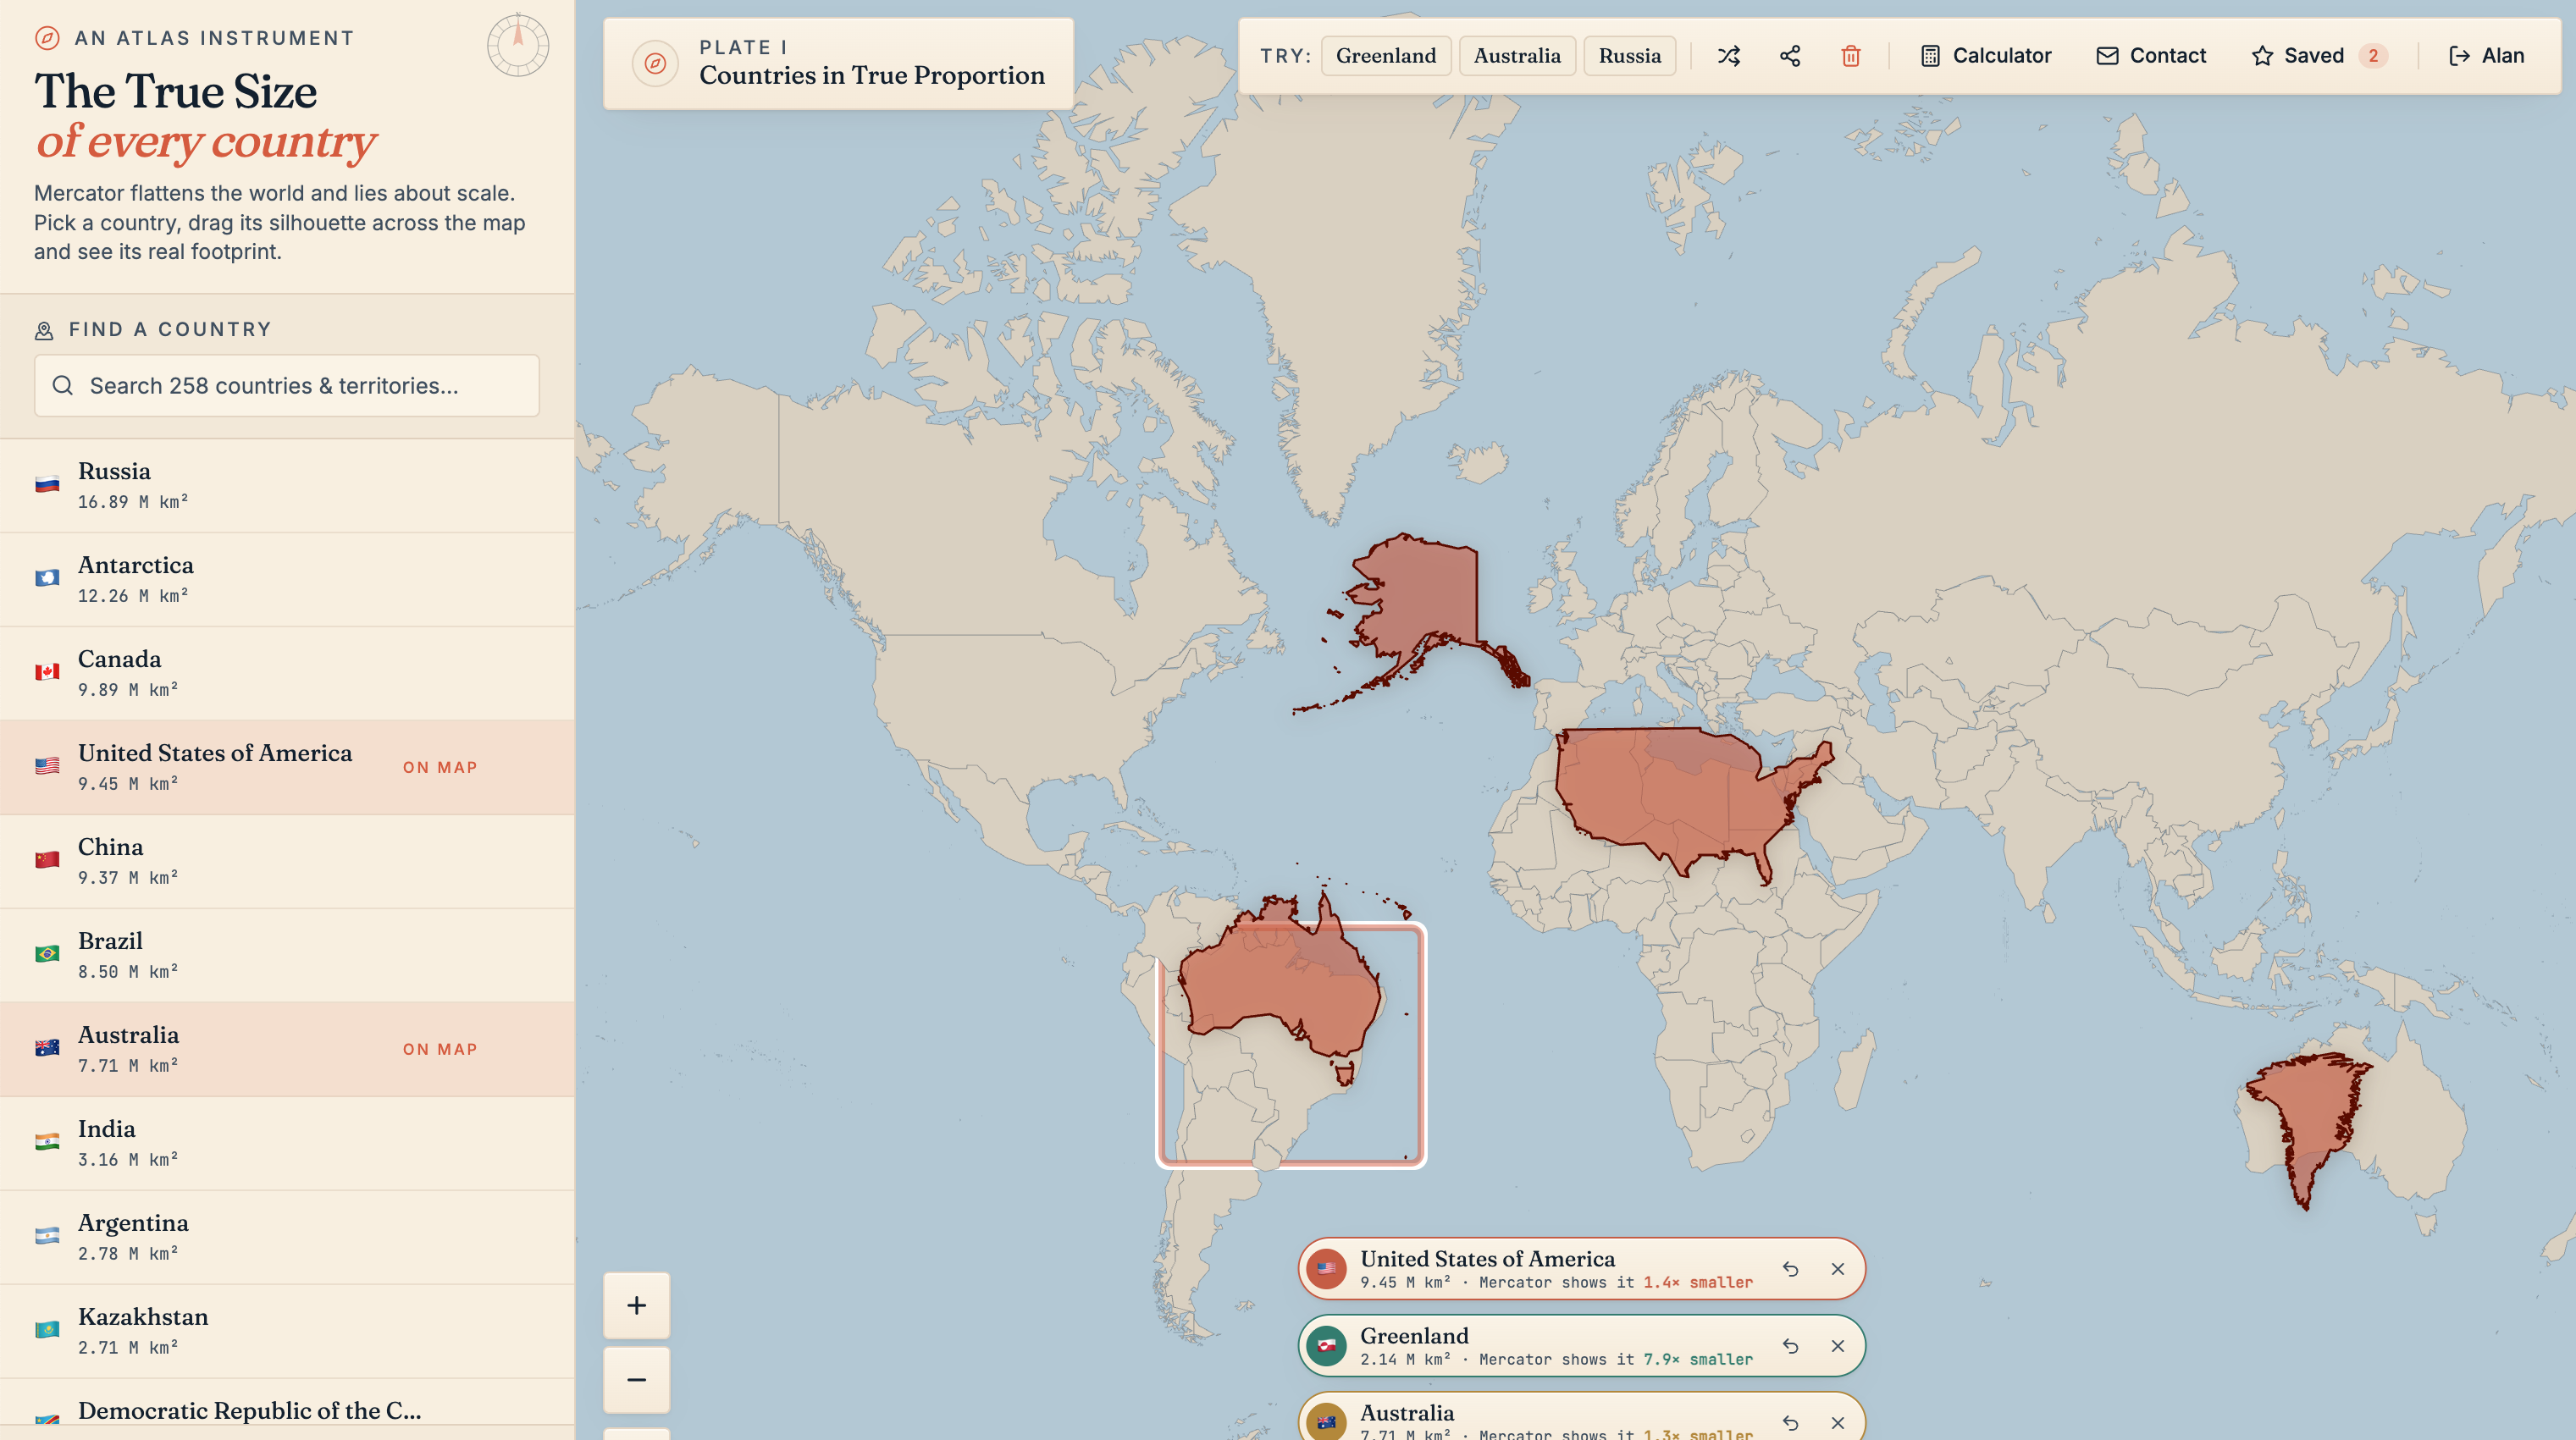
Interactive Map: Country Size Comparison
This use case addressed the challenge of accurately visualizing country sizes distorted by common map projections. Manus developed an interactive tool that allows users to compare the true relative sizes of countries. The outcome is a clearer understanding of global geography, free from projection-based inaccuracies.

Research & Analysis: Streamlining Batch Website Research
The use case addressed the challenge of efficiently gathering and analyzing information on multiple websites for a startup batch. Manus facilitated comprehensive data collection and visualization, enabling users to make informed decisions quickly and effectively.